Price Predictor Template
Template Description
The premise behind the Price Predictor template is that certain technical events in a stock lead to some predictive price action.
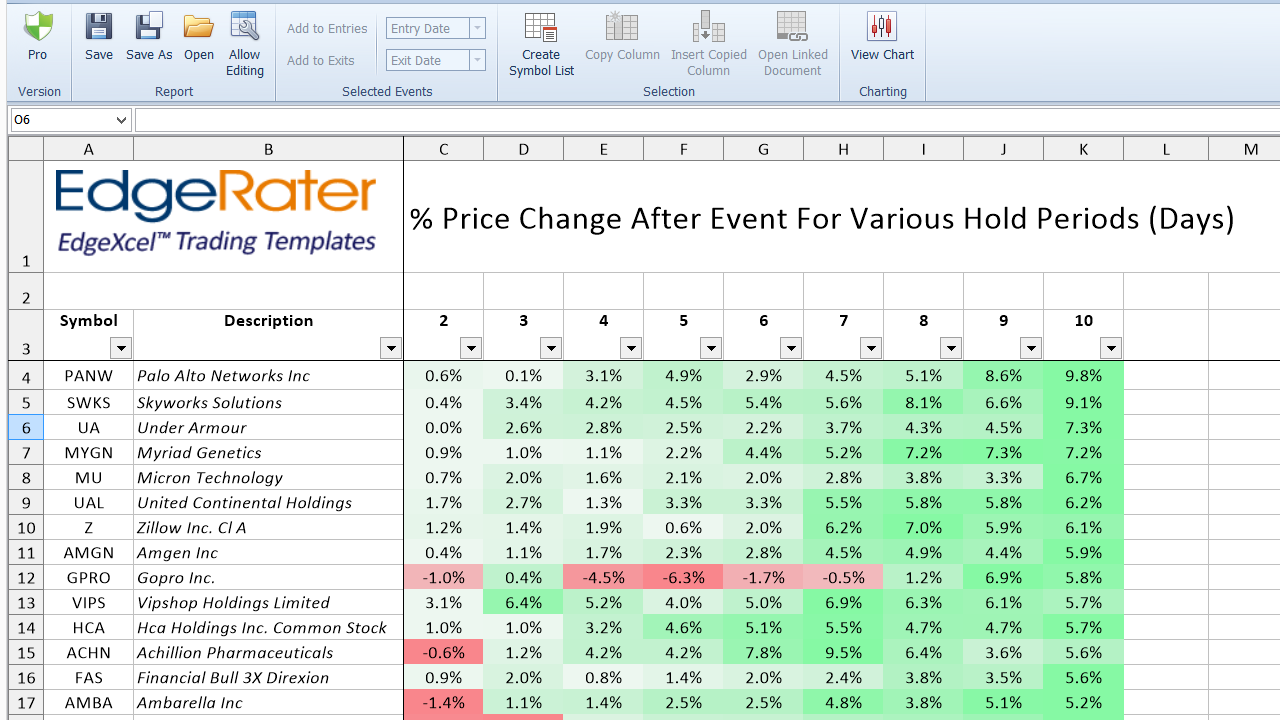
The Price Predictor Template shows the backtested average price % change after your chosen event has occurred for many different hold periods. You can choose from hundreds of pre-existing events or create your own using your specific technical criteria.
Every stock can respond differently to certain events and so the report generated by this template contains a row for each stock in your symbol list. The data is color coded so that you easily see the big picture when zooming out of the report view.
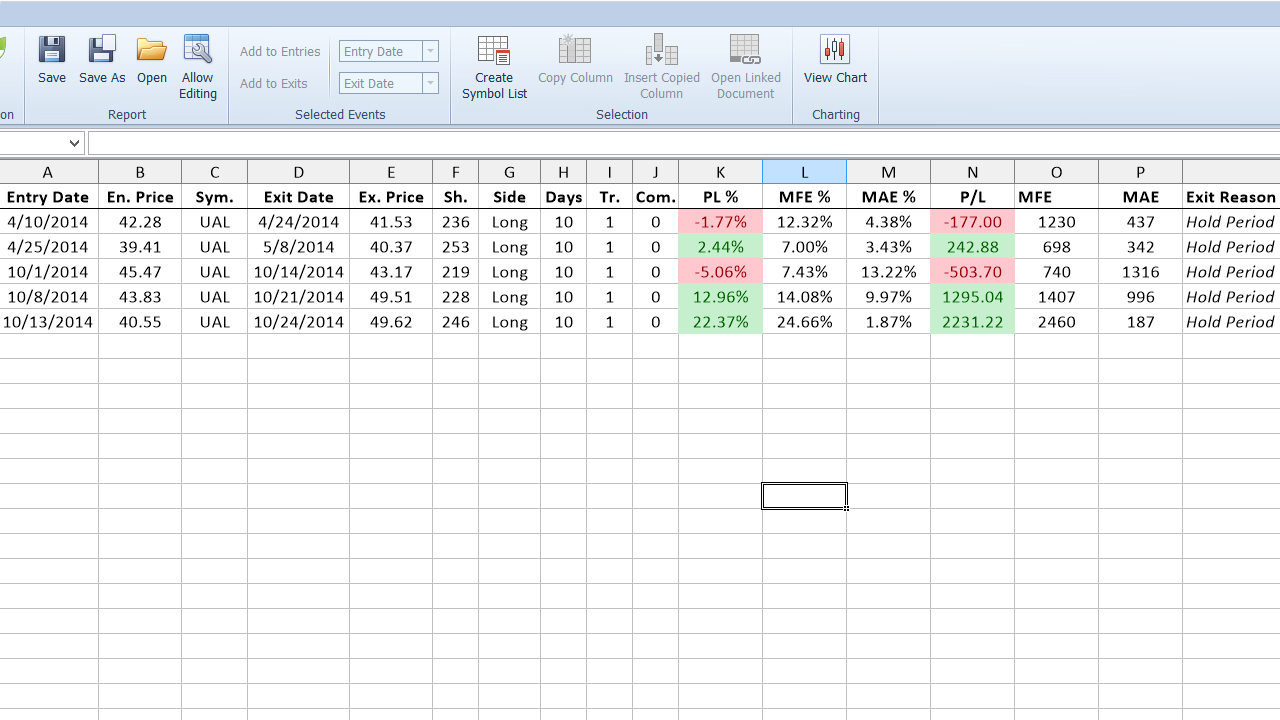
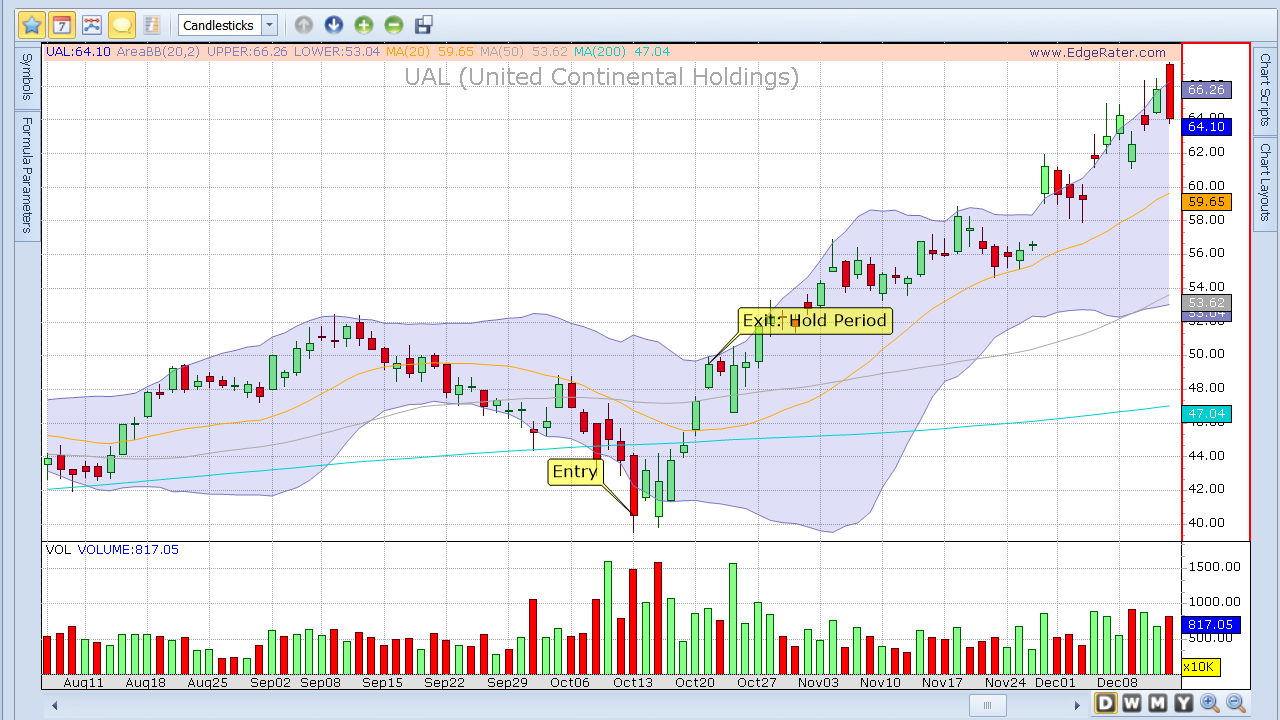
Each column contains the % price change for a particular hold period after the chosen event.Every cell in the report represents an average of all the trades that were simulated over the time period. By clicking on the cell and choosing the 'Open Linked Document' menu option you can see the actual trade list with all the details of each trade. Clicking on any trade in the trade list shows a chart annotated with the entry and exit for that trade.
More Info
- CategoryPro Tools
- Release DateJune 2015
- TagsBacktesting