Performance Between Dates Template
Template Description

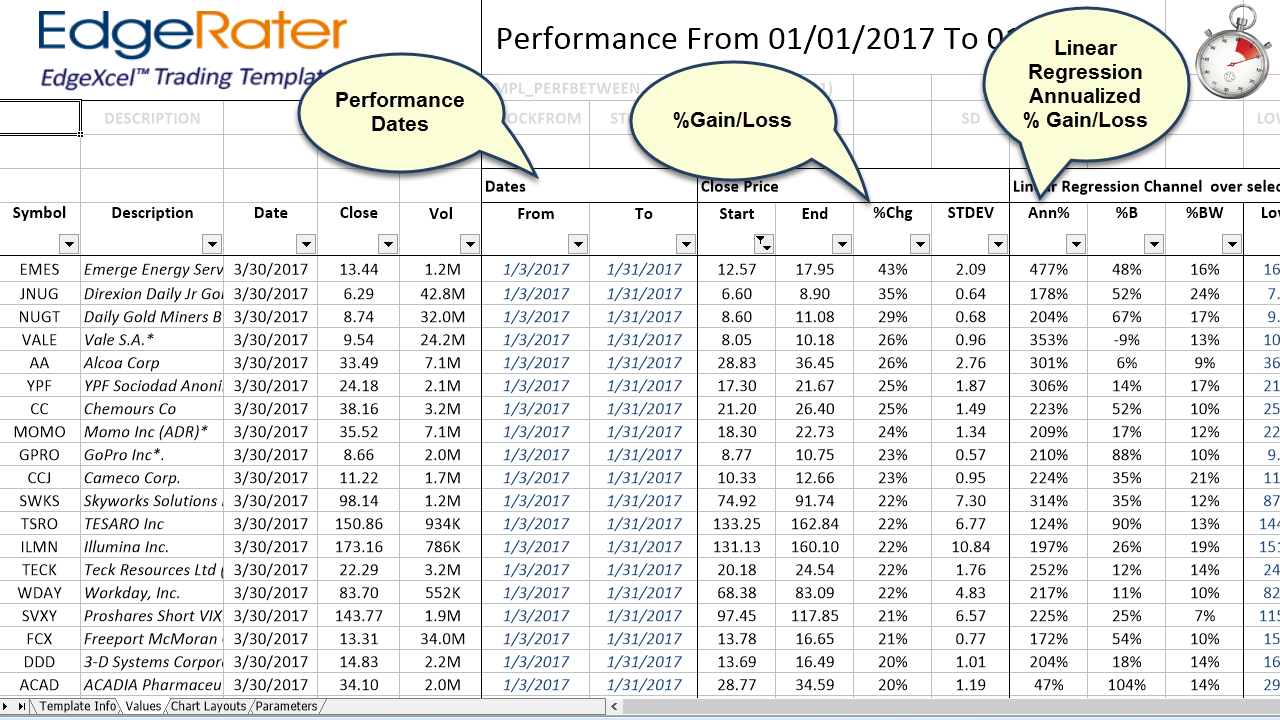
It's often useful to know the individual performance of each stock in a symbol list over a specified time period. Most indicators only allow for a specified lookback period, eg: MA(20) which means you can see the indicator value based on a specified number of bars (not dates).
This template allows you to specify a start and end date and then view the individual performance of all stocks in your symbol list over that time period. The % Gain/Loss is shown and an Linear Regression Line is calculated. The linear regression channel is also calculated and you can see where the stock ended in relation to the channel and how consistent the price behavior was in the time period. The annualized % change of the Linear Regression Line is also displayed.
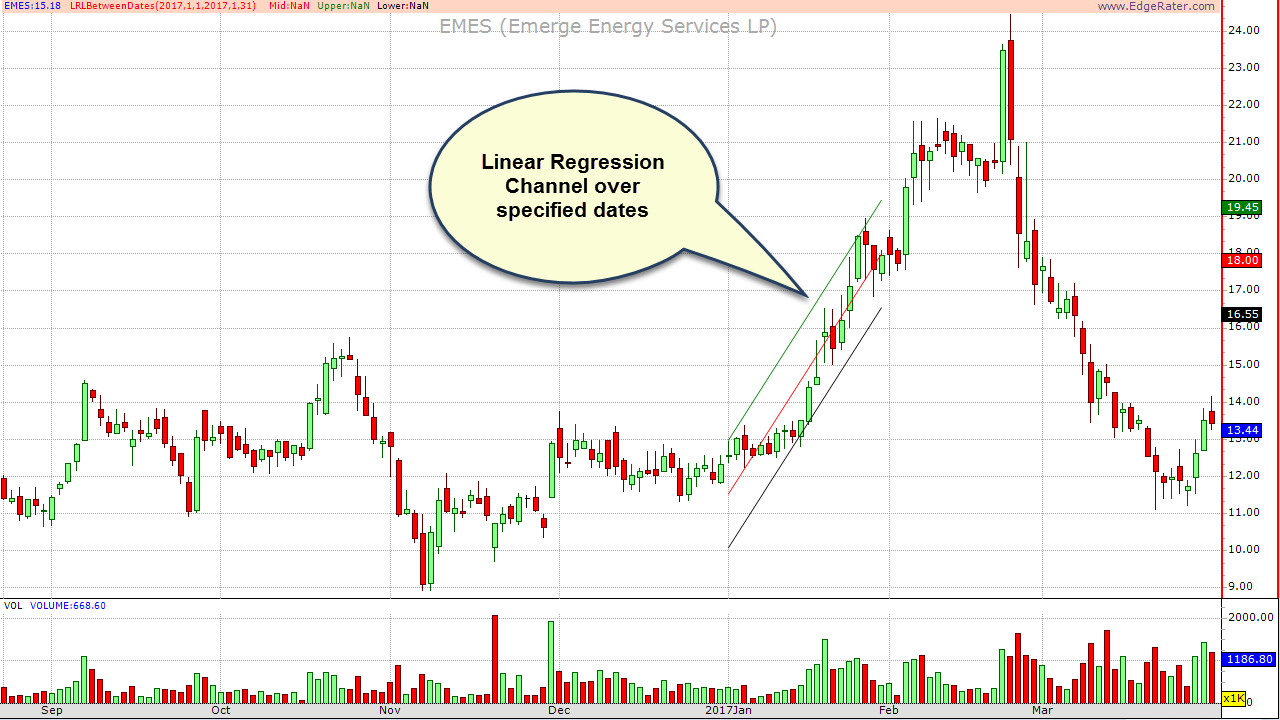
The report is linked to a chart layout that shows the linear regression line and channel overlayed on the price chart for the specified time period.
More Info
- CategoryPRO Tools
- Release DateMarch 2017
- TagsPRO Tools