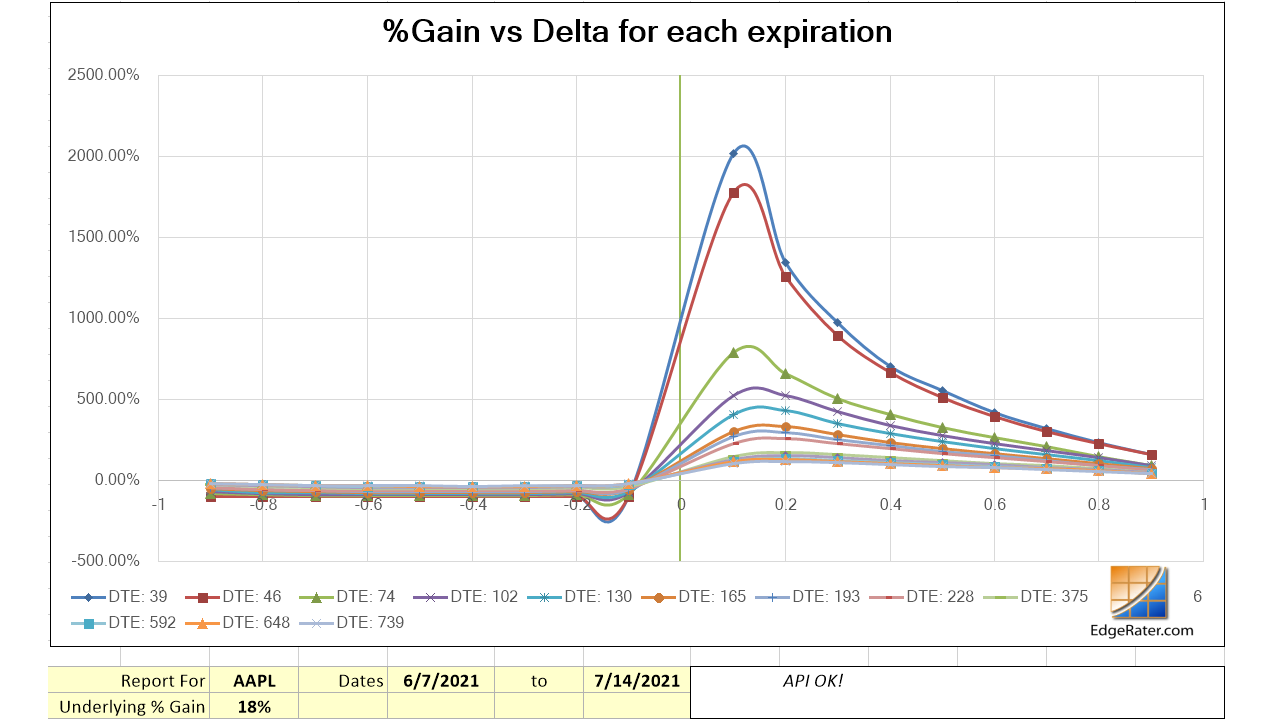
This template will calculate and display the % gain of all options for the underlying symbol that were available on both the From and To dates. Once the report is produced and showing in the Reports tab, it will be sensitve to the 'Line' and 'Linear Regression' tools of the chart and will update options performance based on the start and end point of the drawn tools.
This template calls out to an API to get the data and requires that you have a current subscription to EdgeRater premium data.