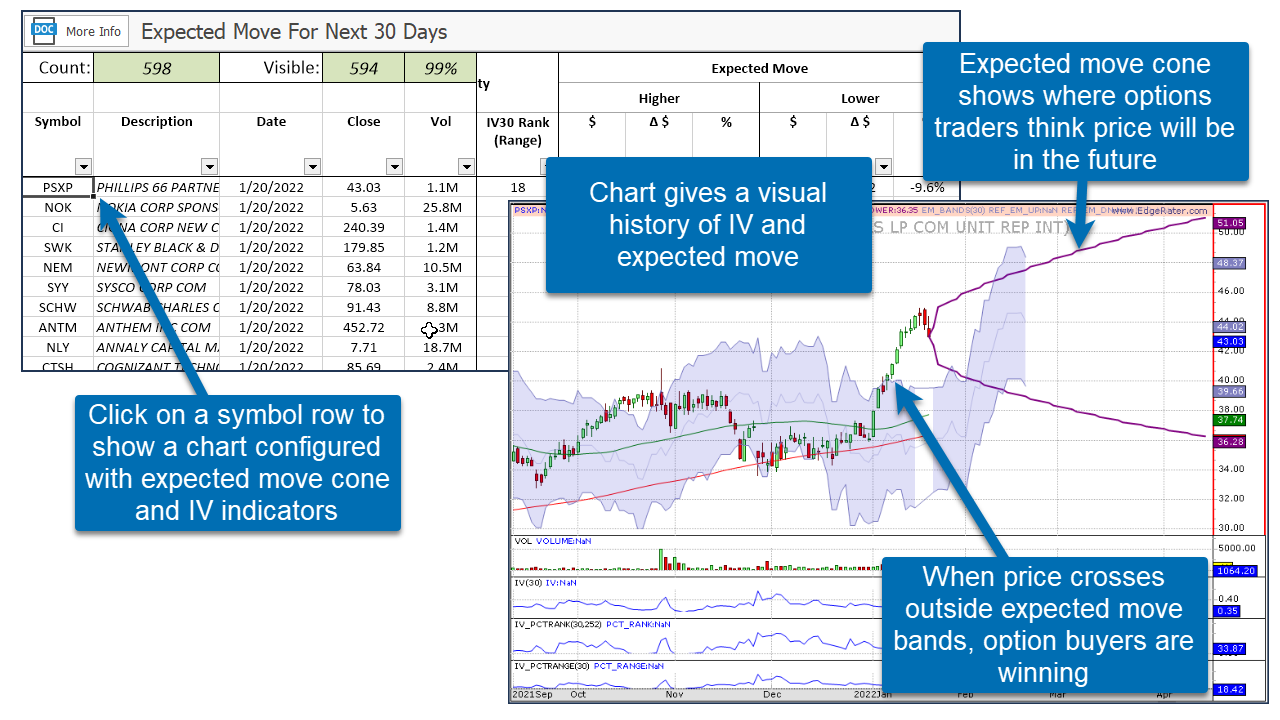
And where price is in relation to the expected move bands
The Chart Layout is pre-configured
To show indicators relevant to the report
just click on a report symbol
to show the chart
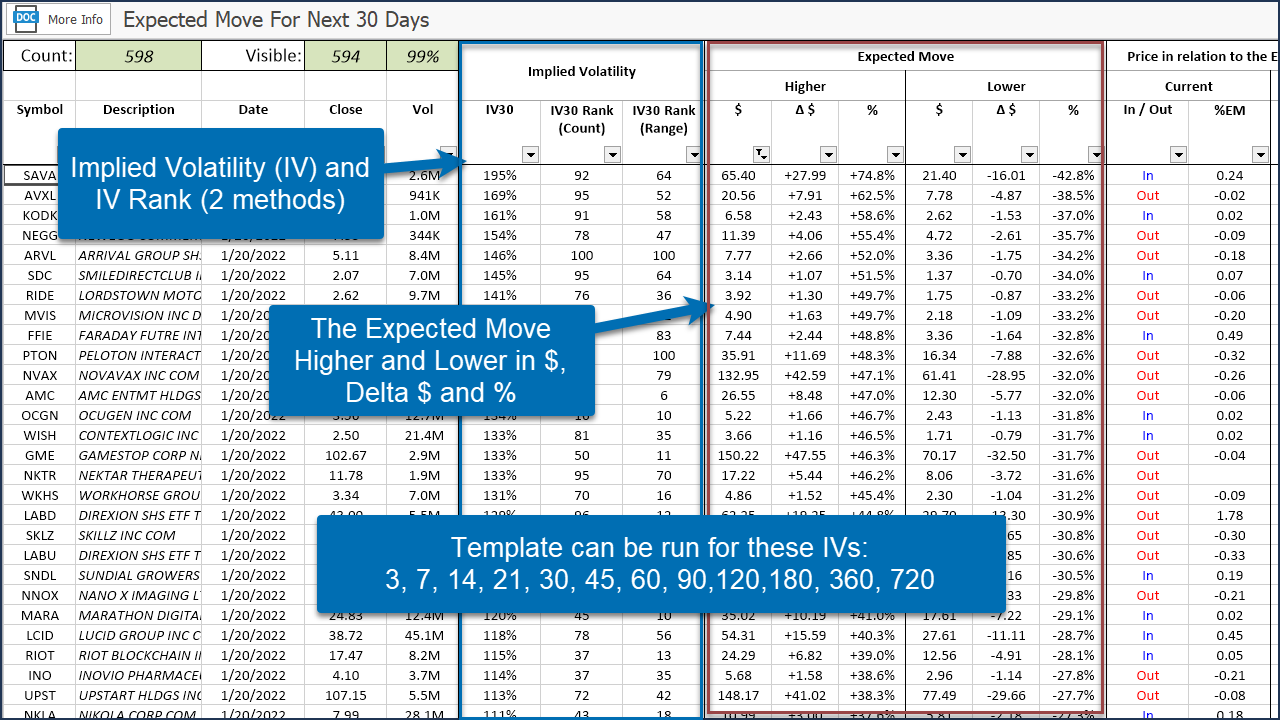
Template Description
The Expected Move for the next N days in a stock is the 1 standard deviation move based on implied volatility. Implied volatility for N days is calculated from a stock's option prices for an N days to expiration option, or if an exact N days to expiration option is not available, it is calculated by interpolating from the option series either side of the expiration.
Expected Move is the best guess at where the stock's price will be at some future point based on what prices traders are willing to trade the options at today.
The math states that price should be within the expected move 68% of the time.
This template produces a report showing expected move for one of 12 selectable periods and also shows how often that stock has historically stayed within its expected move.