This quick-start tutorial will lead you through the process of running a trade simulation over a group of stocks. A trade entry will be taken short when the stock crosses above its upper Bollinger Band and covered when it crosses below its lower Bollinger Band:
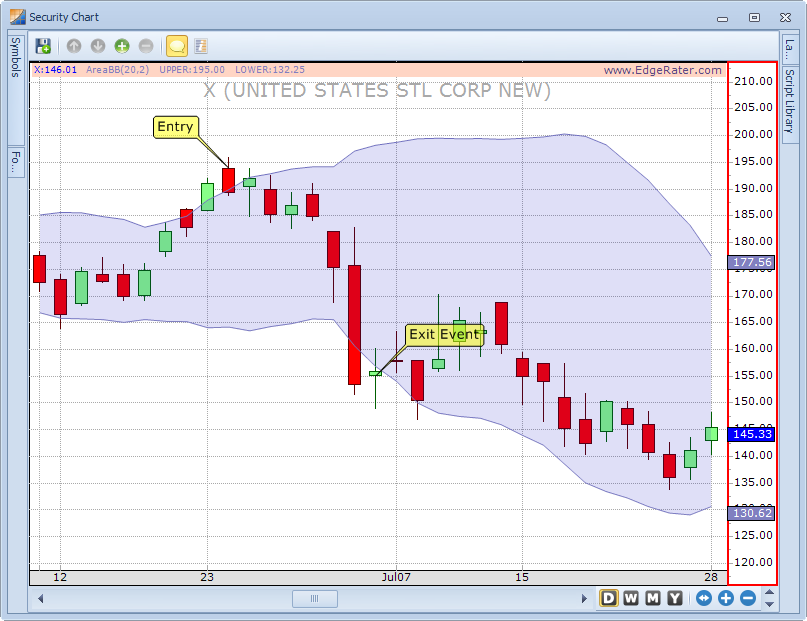
An example short side trade taken by the simulation
The trades will be entered at the open the day after the upper band cross and closed at the open the day after the lower band cross as can be seen in the above chart.
To sum up our plan:
Entry Signal: Stock crosses above upper Bollinger Band
Enter When: Next Day at open
Entry Side: Short
Exit Signal: Stock crosses below lower Bollinger Band
Exit When: Next Day at open
Number of stocks: 498 (S&P 500)
Stock Data*: The historical sample data included with EdgeRater PRO
*Note that EdgeRater can access many different sources of data to give you the latest signals but to keep this tutorial consistent for everybody a default canned set of historical data is being used.